When Should a Tutor Hold Back? A Toy Model’s Ceiling Problem
notebook
human-ai collaboration
feedback-and-cybernetics
expertise
A toy AI-tutoring model changes how often it helps, but every tested threshold reaches the same final-skill ceiling. That exposes a measurement limit, not a finding about student learning.
AI tutoring raises two distinct evaluation questions: does the tutor make an appropriate move now, and what can the learner do later without it?
Ai2’s TutorMoments addresses the first question. Experienced math teachers annotate decision points in real one-on-one tutoring transcripts, identifying moments that call for scaffolding or a push for greater rigor. The transcript is cut at a selected point, and a language model takes over as tutor for five turns with another language model playing the student. An automated scoring pipeline evaluates whether the tutor provides appropriate scaffolding, pushes for rigor when called for, and avoids over-scaffolding. Over-scaffolding is not a third desired response; it means reducing the challenge more than the moment warrants.
These scores measure tutor behavior against teacher-informed reference labels. As Ai2 explicitly cautions, simulated student responses do not establish whether real students learned.
Independent evidence about learning comes from Bastani et al.’s PNAS randomized trial of GPT-4 math tutors. Conducted at a high school in Turkey with nearly 1,000 students, the study compared two tutor designs with a no-AI control. The authors report that GPT Base improved assisted practice scores but reduced subsequent unassisted exam scores by about 17% relative to control. GPT Tutor, which combined hint-oriented instructions with problem-specific teacher inputs, greatly improved practice scores, while its unassisted exam result was statistically indistinguishable from control. That is not evidence of a positive unassisted learning effect. Nor does the trial isolate withholding answers as the cause: the guarded tutor bundled several design changes. Its same-session exams also do not establish long-term retention.
This notebook builds a deliberately small toy model to explore a measurement problem suggested by that distinction. It is not a reproduction of either source, a test of their claims, or evidence about students. It compares answer correctness during a simulated session with a final internal skill value. The toy’s correctness score is not TutorMoments’ appropriateness score, and its skill variable is not an observed exam result. In the executed runs, the final-skill metric saturates and cannot distinguish the tested thresholds.
The toy model
Each simulated learner starts with skill = 0.20 and works through 120 items. Skill is a single number bounded by [0, 1]. At each item:
Difficulty is drawn uniformly from 0.15 to 0.85. The probability of solving the item unaided is a logistic function of skill - difficulty.
The tutor observes that gap with Gaussian noise. It holds back when the estimated gap exceeds a threshold tau, and helps otherwise.
On a helped turn, the answer is scored correct automatically and skill increases by 0.010.
On an unaided turn, success adds 0.060 skill. Failure adds 0.030 unless the true skill–difficulty gap is below −0.35; that failure adds only 0.002 and activates a flag called frustrated.
Skill is clipped at 1.0 after every update. There is no forgetting, disengagement, or delayed retention test. Reaching 1.0 does not imply a 100% probability of solving every item.
All gains and cutoffs are assumptions, not estimates from either source. In particular, the frustration flag is a rule in the simulation, not a measure of anyone’s emotional state.
For a fixed estimated gap, raising tau makes helping more likely because the tutor holds back only when est_gap > tau. Across a whole session, changing the threshold also changes the skill trajectory.
import numpy as npimport pandas as pdimport matplotlib.pyplot as pltRNG_SEED =20260907# --- toy parameters, hand-chosen, not fit to any data ---GAIN_HELPED =0.010# passive gain when handed the answerGAIN_STRUGGLE_WIN =0.060# solved it unaidedGAIN_STRUGGLE_LOSS =0.030# tried and missed, but engagedGAIN_FRUSTRATED =0.002# tried, way over their headFRUSTRATION_GAP =-0.35# true gap below this => frustration on failureOBS_NOISE =0.12# tutor misreads the student by this muchSLOPE =8.0# logistic steepness of solve probabilitydef solve_prob(skill, difficulty):return1.0/ (1.0+ np.exp(-SLOPE * (skill - difficulty)))def run_session(tau, n_items=120, skill0=0.20, seed=0):"""Simulate one student under a hold-back threshold tau.""" rng = np.random.default_rng(seed) skill = skill0 rows = []for t inrange(n_items): difficulty = rng.uniform(0.15, 0.85) true_gap = skill - difficulty est_gap = true_gap + rng.normal(0.0, OBS_NOISE) hold_back = est_gap > tauifnot hold_back: turn_correct =1 frustrated =0 gain = GAIN_HELPEDelse: solved = rng.random() < solve_prob(skill, difficulty) turn_correct =int(solved)if solved: frustrated =0 gain = GAIN_STRUGGLE_WINelif true_gap < FRUSTRATION_GAP: frustrated =1 gain = GAIN_FRUSTRATEDelse: frustrated =0 gain = GAIN_STRUGGLE_LOSS skill =float(np.clip(skill + gain, 0.0, 1.0)) rows.append({"t": t, "tau": tau, "difficulty": difficulty,"held_back": int(hold_back), "turn_correct": turn_correct,"frustrated": frustrated, "skill": skill, })return pd.DataFrame(rows)# sanity check: one session at a middling thresholddemo = run_session(tau=-0.20, seed=RNG_SEED)print(demo.tail(3).to_string(index=False))print("\nfinal skill:", round(demo['skill'].iloc[-1], 3))print("turn-level correct rate:", round(demo['turn_correct'].mean(), 3))print("hold-back rate:", round(demo['held_back'].mean(), 3))
The demo ends at exactly 1.0, with its final three logged items already at the ceiling. That alone does not establish that other thresholds saturate, but it motivates checking whether final skill can discriminate among them.
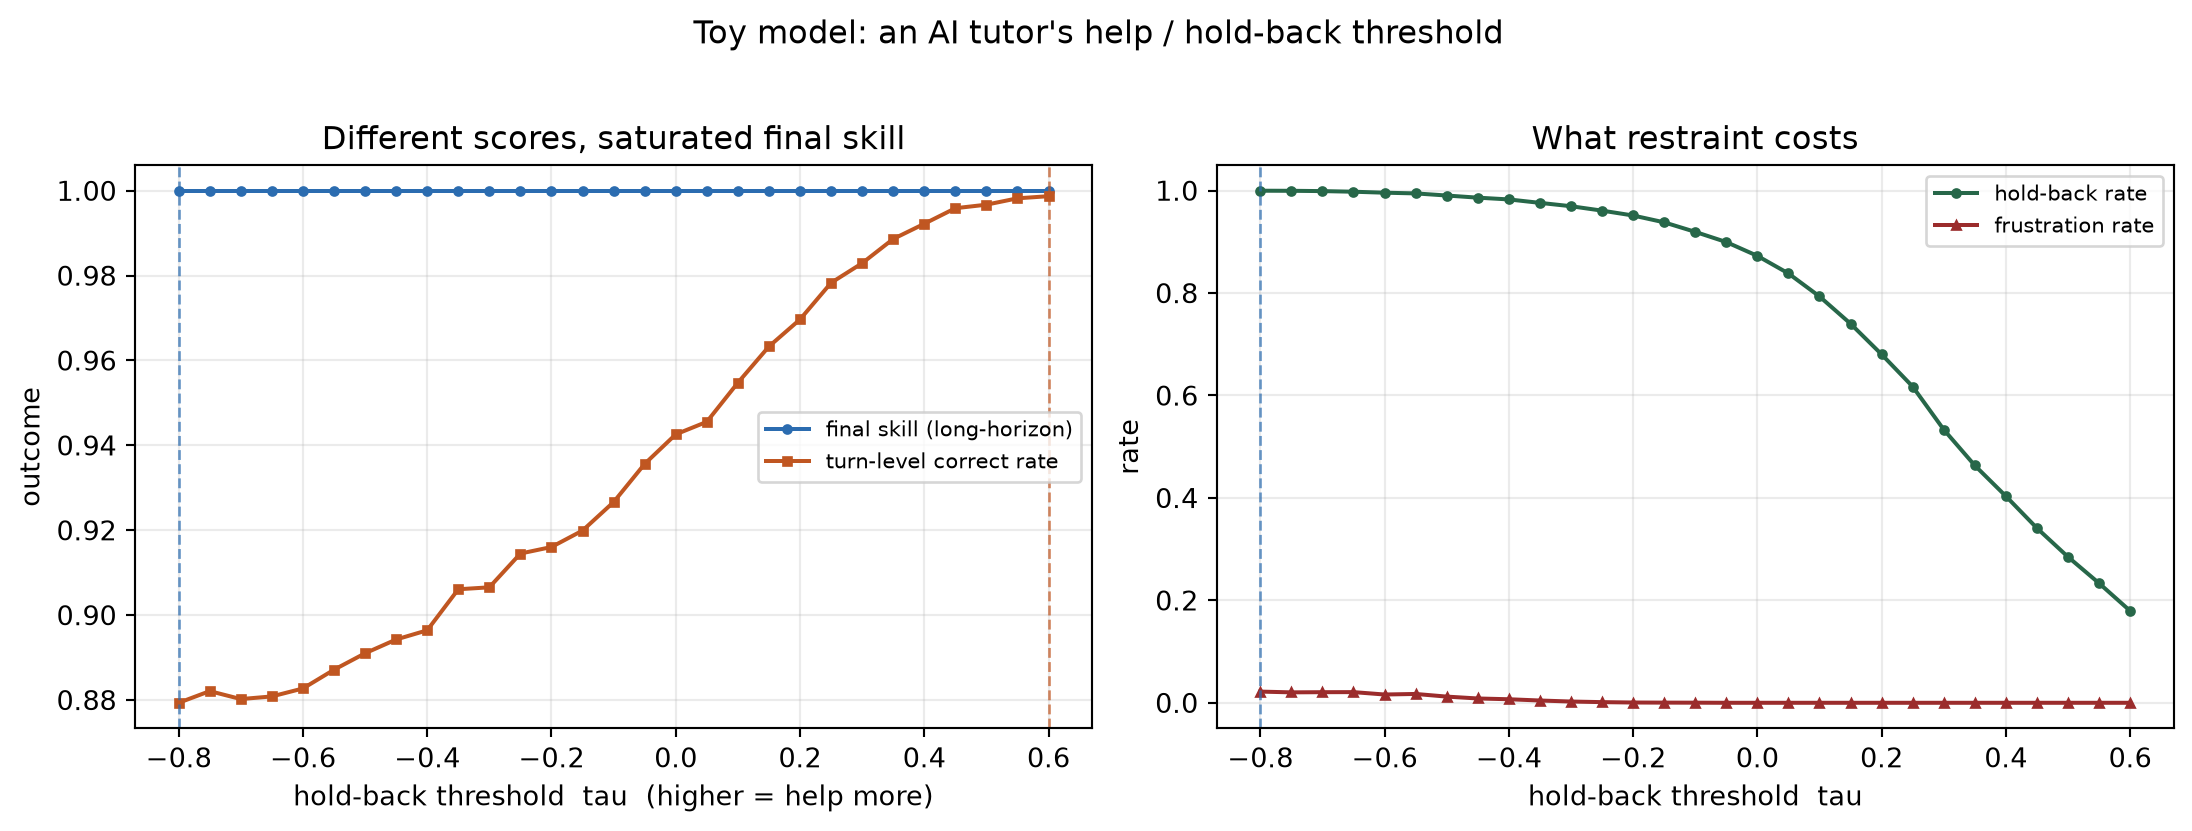
The main sweep evaluates 29 thresholds from −0.80 to 0.60 in steps of 0.05, using 200 seeded simulated trajectories per threshold. It records mean final skill, turn-level correctness, the frustration-flag rate, and the hold-back rate. These are simulation repetitions, not a sample of real students.
The mean final-skill curve is flat at 1.0 across every threshold in the sweep. The printed tau = -0.8 is not a uniquely optimal policy: idxmax returns the first entry among tied maxima. The blue dashed line in both panels therefore marks an arbitrary member of the tie, not a preferred tutoring strategy.
The ceiling has a straightforward explanation. Always helping would add enough skill to move from 0.20 to 1.0 in 80 items, before the 120-item session ends. Other policies follow different paths, including failures with smaller gains, but their mean endpoints also reach the ceiling in these runs. The endpoint cannot reveal differences in how quickly they got there. The chart’s “long-horizon” label refers only to the 120-item simulation, not durable learning.
Turn-level correctness does vary. It generally rises from about 0.879 at tau = -0.8 to a maximum of about 0.999 at tau = 0.6, marked by the orange dashed line. There are small reversals at low thresholds, so the observed curve is not strictly monotonic.
Scoring every helped turn as correct mechanically favors helping at a fixed learner state. But an increase in the threshold also changes subsequent skill, so an increasing session-wide correctness rate is not guaranteed by that scoring rule alone. The observed pattern depends on the transition rules and random draws as well. It is a result of this simulation, not evidence that more help improves real tutoring.
The left panel uses a truncated vertical axis, with ticks from 0.88 to 1.00. That emphasizes the differences in correctness. Although both curves lie on a 0–1 scale, the internal skill value and the fraction of correct turns are different quantities, not interchangeable learning measures.
The right panel shows that the policy changes behavior even when final skill cannot distinguish it. The hold-back rate falls from nearly 1 to about 0.18 as tau increases. The model-defined frustration rate is around 0.02 at low thresholds and approaches zero at higher ones. Both rates average all 120 items, including turns after skill reaches its ceiling. The panel’s reference to “costs” concerns only this assumed frustration rule, not a measured cost to learners.
The toy therefore fails to identify a threshold tradeoff using final skill. It does not establish that real pedagogical tradeoffs are absent, or that other measurements of these simulated trajectories would also be uninformative.
Varying observation noise
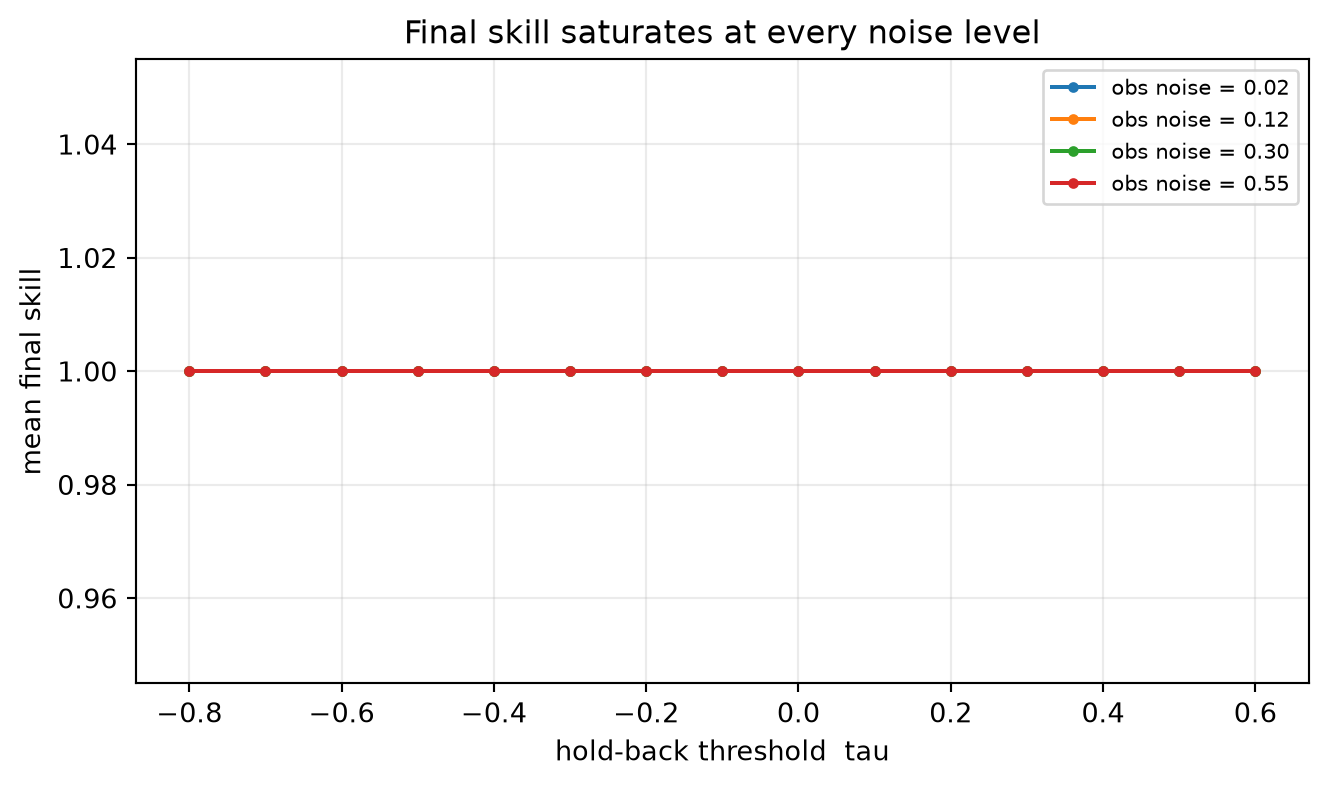
OBS_NOISE is the standard deviation of the Gaussian error added to the true skill–difficulty gap. The next sweep tests four noise levels, using 120 simulated trajectories at each of 15 thresholds spaced 0.10 apart. The question is whether mean final skill distinguishes any of these settings.
NOISE_LEVELS = [0.02, 0.12, 0.30, 0.55]noise_rows = []for noise in NOISE_LEVELS: saved = OBS_NOISEglobals()["OBS_NOISE"] = noisefor tau in TAUS[::2]: finals = [run_session(tau, seed=RNG_SEED +7* s +int(tau *100))["skill"].iloc[-1]for s inrange(120)] noise_rows.append({"noise": noise, "tau": tau, "final_skill": np.mean(finals)})globals()["OBS_NOISE"] = savednoise_df = pd.DataFrame(noise_rows)fig, ax = plt.subplots(figsize=(7, 4.2))for noise, grp in noise_df.groupby("noise"): ax.plot(grp["tau"], grp["final_skill"], marker="o", ms=3, label=f"obs noise = {noise:.2f}")ax.set_xlabel("hold-back threshold tau")ax.set_ylabel("mean final skill")ax.set_title("Final skill saturates at every noise level")ax.legend(fontsize=8)ax.grid(alpha=0.25)fig.tight_layout()plt.show()summary = (noise_df.loc[noise_df.groupby("noise")["final_skill"].idxmax()] .rename(columns={"tau": "best_tau", "final_skill": "best_skill"}))print(summary.to_string(index=False))
At all four tested noise levels—0.02, 0.12, 0.30, and 0.55—the plotted mean final skill remains at 1.0 across the tested thresholds. The curves overlap, leaving the last-drawn red curve visible. Axis ticks above 1.0 are plotting padding; the modeled skill cannot exceed 1.0.
The table’s best_tau is −0.8 in every row because idxmax again selects the first tied maximum. This does not show that observation noise has no effect on decisions or earlier skill development. It shows that the chosen endpoint does not reveal such effects under these tested settings.
Limits and untested follow-ups
Endpoint discrimination. A shorter session, smaller gains, a forgetting process, or an area-under-the-skill-curve measure could change whether policies remain distinguishable. This notebook does not test those alternatives, and removing saturation would not validate the model as an account of human learning.
Scoring assumptions. Help is always correct, every interaction adds nonnegative skill, and the gains are hand-chosen. The notebook does not model the AI errors discussed in the PNAS study or estimate how different kinds of help affect learning.
Learner representation. A single skill value omits topic-specific knowledge, misconceptions, motivation, and disengagement. The frustration flag cannot establish how a learner would experience a difficult task.
Tutor representation. Binary help versus hold-back omits the varied tutor moves described by Ai2, including hints, alternative representations, and requests for justification. This threshold policy does not reproduce TutorMoments’ teacher-informed judgments about when those moves are appropriate.